1. Problem Recognition, Definition, and Evaluation
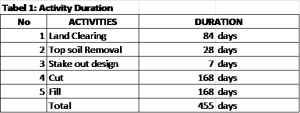
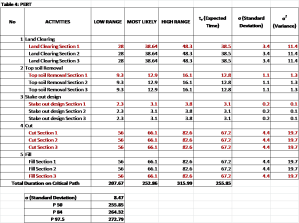
Base on productivity and volume of work for earth work job, duration of each activity for schedule development was calculated as on table1.
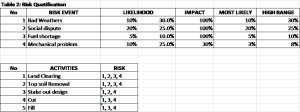
Risk for those activities are identified and quantified as on table 2.
Need to develop schedule contingency refer to risk identified with percentile 90%
2. Development of the Feasible Alternative
Best practice to develop schedule contingency from GOA Schedule Assessment Guide1:
3. Development of the Outcomes and Cash flows for Each Alternative
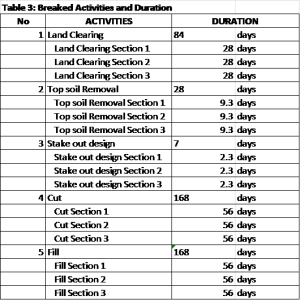
Break the activities duration max. 4 weeks
LOW RANGE = Duration
MOST LIKELY = Duration x Low likelihood x Impact
HIGH RANGE = Duration x High likelihood x Impact
4. Selection of Criterion (or Criteria)
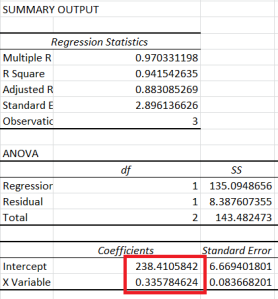
Regression Linear is to calculate Schedule contingency with Probability 90% from data P50, P84 and P 97.5.
P 90 = 238.41+ 0.34 X. -à 50 < X <97.5
P 90 = 268.63 days
5. Analysis and Comparison of the Alternative
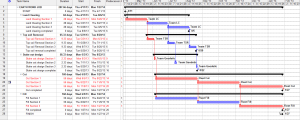
Base on calculation of productivity and volume of work, schedule duration is 207,67 days. Considering the risk identified and impact which may be occur, by have contingency 60.96 days ( 268.63 – 207.67) schedule will have 90% probability to completed on 268.63 days duration.
6. Selection of the Preferred Alternative
In what percentile applied as contingency on the schedule is management decision, it depend on factor such as contract type, project type and technology maturity1
7. Performance Monitoring and Post Evaluation of Result
Schedule contingency may appear as a single activity just prior to finish milestone or it may dispersed throughout the schedule as multiple activities prior to main milestone1.
Even with a well-disciplined risk analysis, management may make bad decision with good information and bad result can happen even from good decision2.
8. References :
- GOA Schedule Assessment Guide (2012), United States Government Accountability Office. Retrieved from: http://www.gao.gov/products/GAO-12-120G
- Humphrey and Associates (2012), Project Management Using Earned Value, Chapter 17. Pp. 325 – 334, Second Editions, Humphreys & Associates, Inc.
- John K. Hollman (2012), Total Cost Management Framework, Section 7.6 pp. 163-176, 1st edition revised, AACE International.
- Scott, Dr. Amos, PE (2012). Skills and knowlage of Cost Engineering, chapter 31 pp 31.1 – 31.8, 5th edition, AACE International, Createspace.
- Sullivan W.G., Wicks E.M., Koelling C.P, (2012), Engineering Economics, Chapter 3 pp. 92 – 93, 15th edition, Prentice Hall.


Hi Pak Anton,
Well, OK……. You fixed the big problem, which was the activities are too long, but I still didn’t see any indication where you added up the variances then found the square root of that value to give you the standard deviation for all activities? I see you have a standard deviation of 8.47, but I haven’t a clue where that came from. I added up all the variances and came out with 152.7 and the square root of that is 12.6…..????
Also, I am really confused about how you used linear regression to generate your probability? Not saying it can’t be done, but you didn’t give us enough information to be able to follow your approach.
Bottom line- I am going to reject this posting and next time, I will be looking for you to demonstrate that for a STRING of activities, you need to add up the variances and then find the square root to find out the Standard Deviation of the STRING. I also will be looking to see evidence that you are using the z tables on pages 619 and 620 of your Engineering Economy, My best advice is to SLOW DOWN and ask for help from your team…… You are doing a lot of work but because you are doing it wrong, you are wasting your own time and building frustration….. ASK FOR SOME HELP ON THIS.
BR,
Dr. PDG, Jakarta